When a WordPress site feels slow, the usual reaction is to install a caching plugin and an image optimizer and hope. Sometimes that works. Often it hides the real problem for a few months, or makes the dashboard and checkout no faster at all.
A slow WordPress site is slow for one of four reasons, and each has a different fix:
- The server. It takes too long to start answering.
- The code. The theme, plugins or database make WordPress work too hard to build each page.
- The assets. Images, CSS, JavaScript and fonts take too long to arrive and render.
- Third-party scripts. Chat widgets, pixels, tag managers and embeds that run on someone else's server.
The tests that tell them apart are free. This is the order I check them in, and what to do once you know which one it is.
First, measure the right thing
Run your homepage and your most important page through PageSpeed Insights, on mobile. The report shows two different things, and mixing them up causes most of the confusion:
- Field data at the top: how real Chrome users experienced your page over the previous 28 days (the Chrome UX Report).
- Lab data and the score below it: one simulated load by Lighthouse, on one device and one network profile. Google says plainly that the two "may differ".
When they disagree, trust the field data, because that's what your visitors actually got. Small sites often don't have enough traffic for field data; then use the lab numbers as a guide and test on a real phone.
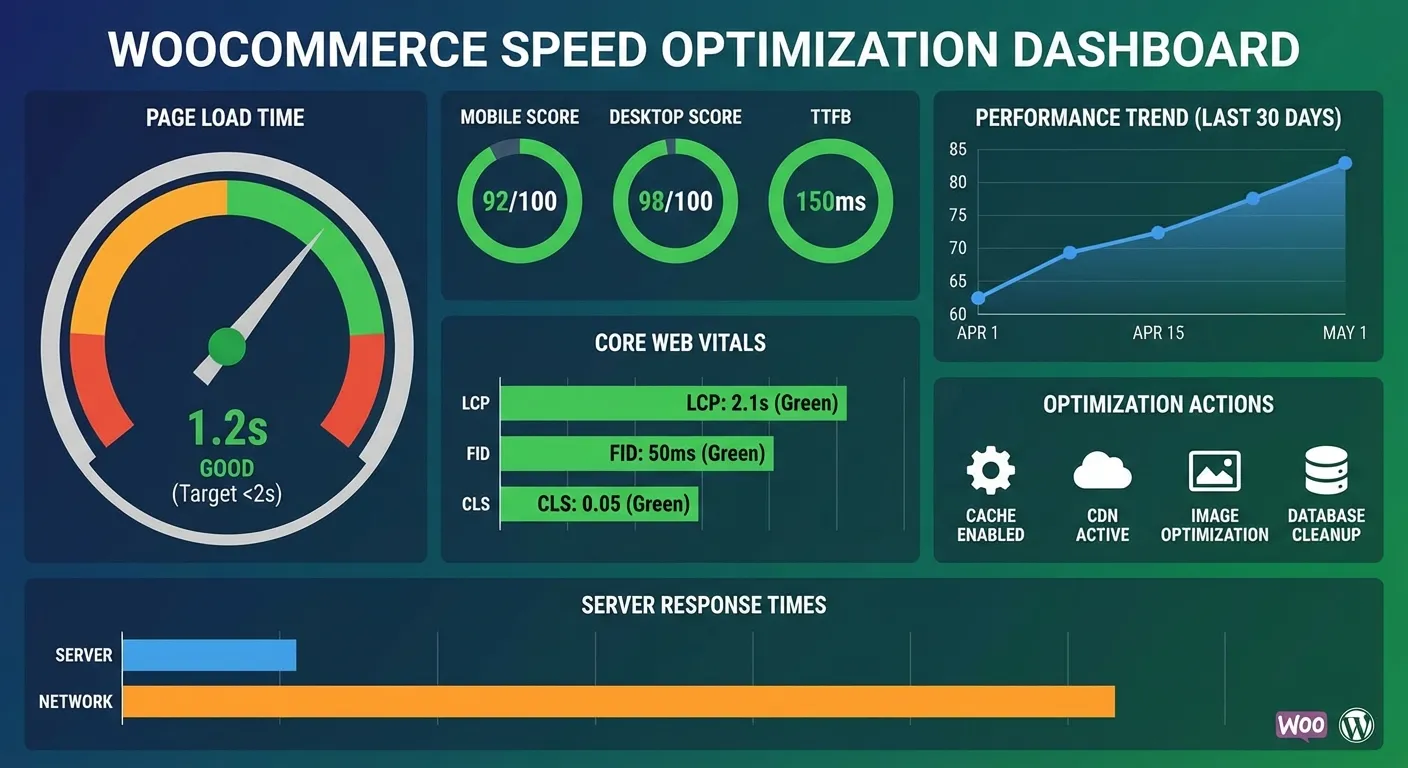
The three numbers that matter are the Core Web Vitals. web.dev defines "good" as:
| Metric | What it measures | Good |
|---|---|---|
| LCP (Largest Contentful Paint) | When the main content appears | 2.5 s or less |
| INP (Interaction to Next Paint) | How fast the page reacts to taps, clicks and typing | 200 ms or less |
| CLS (Cumulative Layout Shift) | How much the layout jumps around | 0.1 or less |
Each is measured at the 75th percentile of page loads, separately for mobile and desktop. INP replaced FID on March 12, 2024, so any guide that still tells you to optimize FID is out of date.
A word on rankings. Google says Core Web Vitals are used by its ranking systems, and in the same document that "Google Search always seeks to show the most relevant content, even if the page experience is sub-par." Speed won't rank a weak page. The bigger cost of a slow site is the visitors who give up before it loads.
Step 1: Is it the server?
Time to first byte (TTFB) is how long the server takes to start sending the page. web.dev's rough guide: 0.8 seconds or less is good, more than 1.8 seconds is poor. TTFB isn't a Core Web Vital itself, but nothing else can start until it's done, so a slow TTFB drags LCP down with it.
Measure it from your terminal a few times in a row:
curl -o /dev/null -s -w "TTFB: %{time_starttransfer}s\n" https://yoursite.com/
Then open Tools → Site Health in WordPress. Since WordPress 6.1 it checks two things here: whether a full-page cache is detected and whether the server responds in under 600 ms, and whether the site would benefit from a persistent object cache.
How to read the results:
- Slow every time, even on a cached page. The server is the bottleneck: an overloaded shared plan, no page cache at all, or a data center far from your visitors. Fix this first, because nothing else will make up for it.
- Fast for visitors, slow when logged in, in the cart or in wp-admin. The page cache is doing its job and hiding slow code. Go to step 2.
- No page cache detected. Turn on the one your host provides, or a caching plugin if it doesn't. This is the one case where "install a caching plugin" really is the fix.
Two server settings to check while you're there:
- PHP version. WordPress recommends PHP 8.3 or greater. PHP 8.1 and older no longer get security fixes, and 8.2's security support ends on 31 December 2026 (php.net). Switching is usually one setting in the hosting panel. Test on a staging copy first, because old plugins are what break.
- Persistent object cache. Redis or Memcached keeps database results in memory between requests. It helps exactly the pages a page cache can't serve: logged-in users, carts, checkout, search and the admin. If Site Health recommends one, ask your host whether they offer it.
Step 2: Is it the code?
If cached pages are fast but anything uncached is slow, the time is spent inside WordPress: the theme, the plugins and the database queries they run.
Install Query Monitor (free), ideally on a staging copy, open the slowest page while logged in and look at three panels:
- Queries by Component shows which plugin or theme runs the most database queries and how long they take. One plugin owning most of the time is a common, very fixable result.
- HTTP API Requests shows plugins that call external servers while the page is being built: license checks, feeds, remote APIs. Each one adds its full response time to your TTFB.
- Database Queries flags slow, duplicate and failed queries.
Then check two things Query Monitor won't point at directly.
Autoloaded options. On every request, WordPress loads all "autoloaded" rows from the wp_options table. Plugins you deleted years ago often leave large rows behind. Since WordPress 6.6, Site Health shows a critical issue when the total passes 800 KB, and new options larger than 150 KB are no longer autoloaded by default. To see the total yourself:
SELECT ROUND(SUM(LENGTH(option_value)) / 1024) AS autoload_kb
FROM wp_options
WHERE autoload IN ('yes', 'on', 'auto-on', 'auto');
Those four values are the ones core treats as autoloaded (wp_autoload_values_to_autoload() in wp-includes/option.php). Change wp_ if your table prefix is different, and take a backup before you change anything in that table.
WP-Cron. WordPress runs scheduled tasks on page loads. On a busy site, or one with heavy scheduled jobs, it's better to set define( 'DISABLE_WP_CRON', true ); in wp-config.php and run cron from the server's task scheduler instead.
Heavy themes and page builders belong in this step too. A page built from dozens of nested sections produces a large HTML document and loads CSS and JavaScript for every widget type used. If you're on Elementor, see Elementor speed optimization. For plugins in general, the 30-minute plugin audit is the fastest way to find what you can remove.
Step 3: Is it the assets?
If TTFB is fine but LCP is still slow, the time goes after the HTML arrives. PageSpeed Insights names the LCP element and splits its time into phases, which tells you whether the problem is the file itself or how late the browser found out about it.
Images. WordPress already creates resized copies and a srcset for images in your content. The trouble usually comes from images it doesn't control: a full-size photo set as a CSS background in a page builder section, or a slider that loads every slide up front. Resize those at the source. WordPress handles WebP, and AVIF since 6.5 if your server's image library supports it (Site Health shows this).
Don't lazy-load the LCP image. Since WordPress 6.3, core adds fetchpriority="high" to the image it expects to be the LCP image and doesn't lazy-load it. Themes, builders and optimization plugins that write their own image markup can undo that. If the LCP element in PageSpeed Insights has loading="lazy", that's your fix.
CSS, JavaScript and fonts. Large stylesheets and scripts in the <head> block rendering. Optimization plugins can defer or delay JavaScript, and it often helps, but it's also the setting most likely to break sliders, forms and checkout, so test every page type after you turn it on. Self-host your fonts and load only the weights you use.
Speculative loading. Since WordPress 6.8, core prefetches the next page when a logged-out visitor starts clicking a link, which makes moving to the next page feel quicker. It doesn't make the first page faster, so it's a bonus rather than a fix.
Step 4: Is it third-party scripts?
Chat widgets, ad and social pixels, a Google Tag Manager container that has grown for years, A/B testing tools, embedded maps and YouTube videos. They load from someone else's server, so better hosting can't speed them up, and they compete with your own code for the browser's main thread. That shows up as poor INP: the page looks ready but reacts slowly to taps.
The test is simple: block them and measure again. In Chrome DevTools, right-click a request in the Network panel and choose "Block request domain", then reload. WebPageTest has the same option under its advanced settings. If the page gets much faster without them, you've found your problem.
The fixes are mostly decisions, not code: remove tags nobody looks at any more, load the chat widget when someone clicks the chat button, and show a static preview image for videos and maps until the visitor clicks.
What a caching plugin can and can't fix
| Problem | Does page caching fix it? |
|---|---|
| Slow TTFB on public pages | Yes, that's what it's for |
| Slow cart, checkout, account pages, wp-admin | No, those pages aren't cached. Fix the code, add an object cache |
| Oversized images | No. Some plugins also compress images, but resizing at the source is better |
| Third-party scripts | Partly, by delaying them, with a risk of breaking things |
| Bloated autoloaded options | No |
The short version
- PageSpeed Insights on mobile: note LCP, INP and CLS from the field data, and what the LCP element is.
curlthe TTFB of the homepage and one important page, a few times each.- Tools → Site Health: page cache, object cache, autoloaded options, PHP version.
- Query Monitor on the slowest uncached page.
- Block third-party domains and test again.
- Fix the biggest of the four first, measure again, then move to the next.
Running a store? WooCommerce is slow in its own places (cart, checkout, orders and background jobs), so read the WooCommerce speed guide next.
If you'd rather hand it over, this is the same order I follow on a WordPress speed optimization job: measure, find the cause, fix it, measure again. For sites where only Google's numbers are failing, see Core Web Vitals optimization. Or send me the URL and tell me which page feels slowest.

15+ years building WordPress sites, plugins and web apps, including 7+ years as a full-stack developer on the Xagio team (the SEO & AEO platform behind a WordPress plugin with 10,000+ active installs). Now AI-accelerated: fixes in hours, sites in days. More about me →